Cloud Server Logging Strategies
Applications need to be monitored to identify issues and perform security auditing.
In the early days of your application, this often performed manually or with some simple tools that check the log files on a small number of servers. As your architecture grows and more servers are required, this becomes more difficult.
Cloud native architectures create, use, and destroy servers routinely, making this practice of logging into a server and reading logs very difficult. A different approach to server logging is necessary as you move toward a Realscale, cloud native architecture. This article looks at the types of server logs you need to monitor and some techniques for managing logging at scale.
Types of Server Logs
While application developers may only check one or two log files, there are a wide variety of logging solutions that scatter various files across a server. Miss one and you’ll lose important insight into your application and server health. Below is a list of each type of log file and their purpose:
System Logging
Operating systems product a system log file that tracks log entries across a variety of devices, services, and operating system modules. They are often used to monitor the health of an individual server’s operations, as well as security auditing. The syslog protocol is most common for Unix-based operating systems, while the Windows Event Log is used for Microsoft operating systems.
Web Access Logging
Every web request received by a web server will result in an access entry that includes the IP address of the client, agent software, URL requested, and resulting response code based on success or failure when processing the request. Access logs provide insight into every web request and are useful for reporting on website traffic.
Application Logging
Applications often log informational, warning, error, and critical log entries. Informational entries are often related to startup and shutdown, general execution requests and times, or configuration settings. Warning log entries may result from improper or missing configuration. Error entries are often a result of code or network failure to process an incoming request or unit of work. While errors indicate that something failed to complete, the application will continue to operate. Critical failures indicate that the application encountered an unrecoverable error and will shutdown or run in degraded mode. Application logs provide insight into the operational status of an application and are a primary indicator of server failures due to bugs, heavy server load, or missing network resources.
Database Logging
Databases often generate 3 log files that are important for monitoring: a general query log,slow query log, and error log. The general query log allows for monitoring and troubleshooting the queries issued and the overall query time. Slow query logs are the most useful as they allow for the logging of queries that exceed a specific threshold. Queries that exceed the threshold may indicate data structures that are no longer optimized due to the scale of data stored, lack of optimized data structures, or poor-performing SQL queries.
Event Logging
Events may originate from various sources: client-side browsers, server-side applications, APIs, and third-party systems. These events inform your application and your staff about the types of interactions your application is servicing. Event logging is often the most difficult to track, as it originates from so many different sources. Tools like Google Analytics are often used by web developers to capture discrete user interactions, while anything from application log files to message brokers may capture events in XML or JSON format. Extracting events from these various streams are important to understanding the overall application health and security auditing.
The Difficulties of Logging in a Cloud Native Architecture
As previously mentioned, watching and analyzing server logs becomes more difficult the more an application moves toward a cloud native architecture. Servers may be created and destroyed in the matter of weeks, days, hours, or perhaps even minutes. This means that log files may be written and then destroyed before any significant analysis may be performed on them. It also makes analysis, auditing, and troubleshooting more difficult as Realscale applications are commonly distributed across a variety of servers and tiers.
There are three options for managing logs across a cloud native architecture: replication, syslog, and log collectors. Let’s look at each option:
Option 1: Log File Replication
As an application architecture grows, the simple approach is to use a tool like rsync to push the latest log file contents to a centralized location. This solves the need of moving log files to a single repository, but still makes monitoring and analysis difficult as the entries are spread across a variety of files rather than aggregating them into one view. Additionally, some log entries may be missed if the server is shutdown prior to a final rsync to the repository. While custom tools and scripts may be used to overcome this problem, solutions exist to solve this: centralized logging and distributed log collectors.
Option 2: Centralized Syslog Repositories
For teams comfortable with using syslog, modern implementations such as syslog-ng and rsyslog allow for a centralized syslog repository to accept syslog entries from other servers. Since the entries are centralized, they are aggregated easily and log entry loss is limited in the case of a server shutdown. While tools exist to search across centralized syslog data, there is not guarantee of the format of the individual log entries across the applications and syslog implementations. As a result, it may become more difficult to obtain accurate insights without extra effort. Plus, storage capacities will be reached over time since all logs are stored on a single centralized server. Modern distributed log collectors attempt to resolve these issues.
Option 3: Distributed Log Collectors
Unlike file replication or centralized logging, distributed logging allows servers to collect and aggregate log entries across one or more log servers. Distributed log collectors overcome a number of issues encountered by other logging solutions in a cloud native architecture: normalized log entries for easier searching, horizontal scaling by the distribution of collectors across any number of servers, and the ability to integrate with other monitoring and analysis tools through plugins. Distributed logging may also be used to capture, aggregate, and stream events as well as log entries.
How Distributed Logging Works
Distributed logging is divided into 5 stages: collection, forwarding, storage, indexing, and alerting.
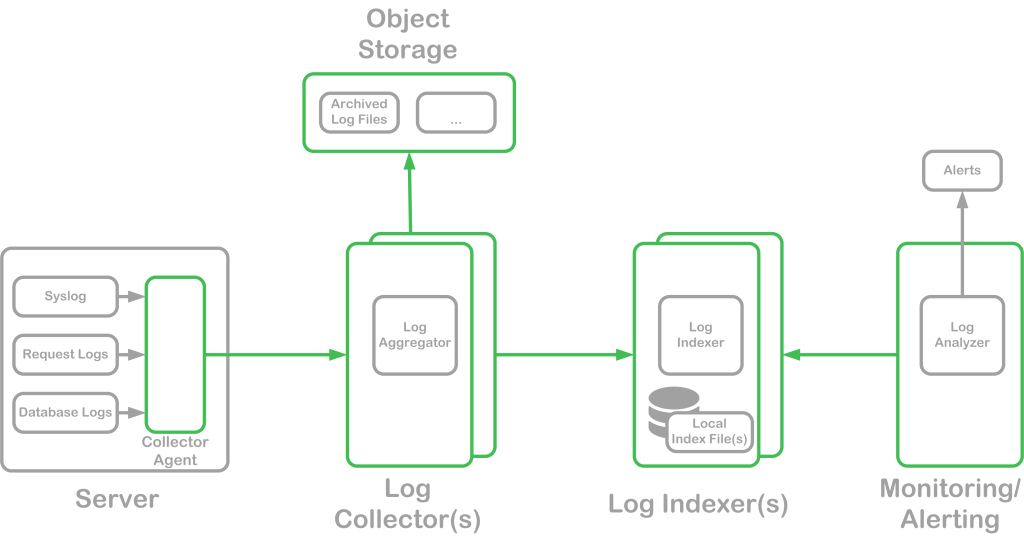
- Collection Stage – Various logs are monitored by the collector agents either using a tail strategy (watching the log file for changes), by subscribing to the logging system when possible (e.g. syslog), or by offering an API for applications to push log entries
- Forwarding Stage – As new log entries are collected by the collector agent, they are forwarded on to the storage processes. For some distributed log solutions, this may simply be another instance of the agent that operates in storage mode. For others, this may be a solution different than the collector agents
- Storage Stage – A local or shared filesystem is often used to store these aggregated events. Configurable settings allow for custom data retention to prevent exceeding available storage. Most systems also offer archiving to object stores and other types of storage options once the local retention limits have been reached
- Indexing Stage – Entries are stored into different data stores in a realtime or batch-based schedule. Tools such as Elasticsearch or HDFS may be used to store and query entries across a specific period of time or based on a specific tag or field value(s)
- Alerting Stage – Patterns are analyzed across entries to determine if thresholds were exceeded or specific patterns are detected. Alerts are then be raised for further investigation and remediation
The logging architecture composed of at least three processes: collector agents, storage processes, and analysis/alerting processes. Some tools package all of these processes together, while others provide some of the processes and require plugins or custom integration to complete the solution. Additionally, distributed logging solutions may be installed and managed in-house, or hosted solutions may be selected to reduce installation and integration time.